





Retail sales taxes remain a cornerstone of American public finance, serving as a primary revenue engine for state and local governments. As of mid-2026, these levies account for approximately 32 percent of all state tax collections and 13 percent of local tax collections. When combined, they represent nearly a quarter of all tax revenue generated within the United States. While often debated by policymakers, sales taxes are widely favored by economists over income taxes for their relative neutrality and lower capacity to distort economic decision-making. However, as the 2026 fiscal year progresses, the interplay between state-level mandates and local-option taxes continues to create a complex, often fragmented, landscape for both consumers and businesses.
The Structural Anatomy of U.S. Sales Taxes
Forty-five states currently levy a statewide sales tax, with 38 of those states granting local jurisdictions the authority to impose their own additional sales taxes. This dual-layer system often results in combined rates that surprise the average consumer. In several regions, local sales tax rates have surged to levels that rival or even exceed the statewide rates imposed by state legislatures.
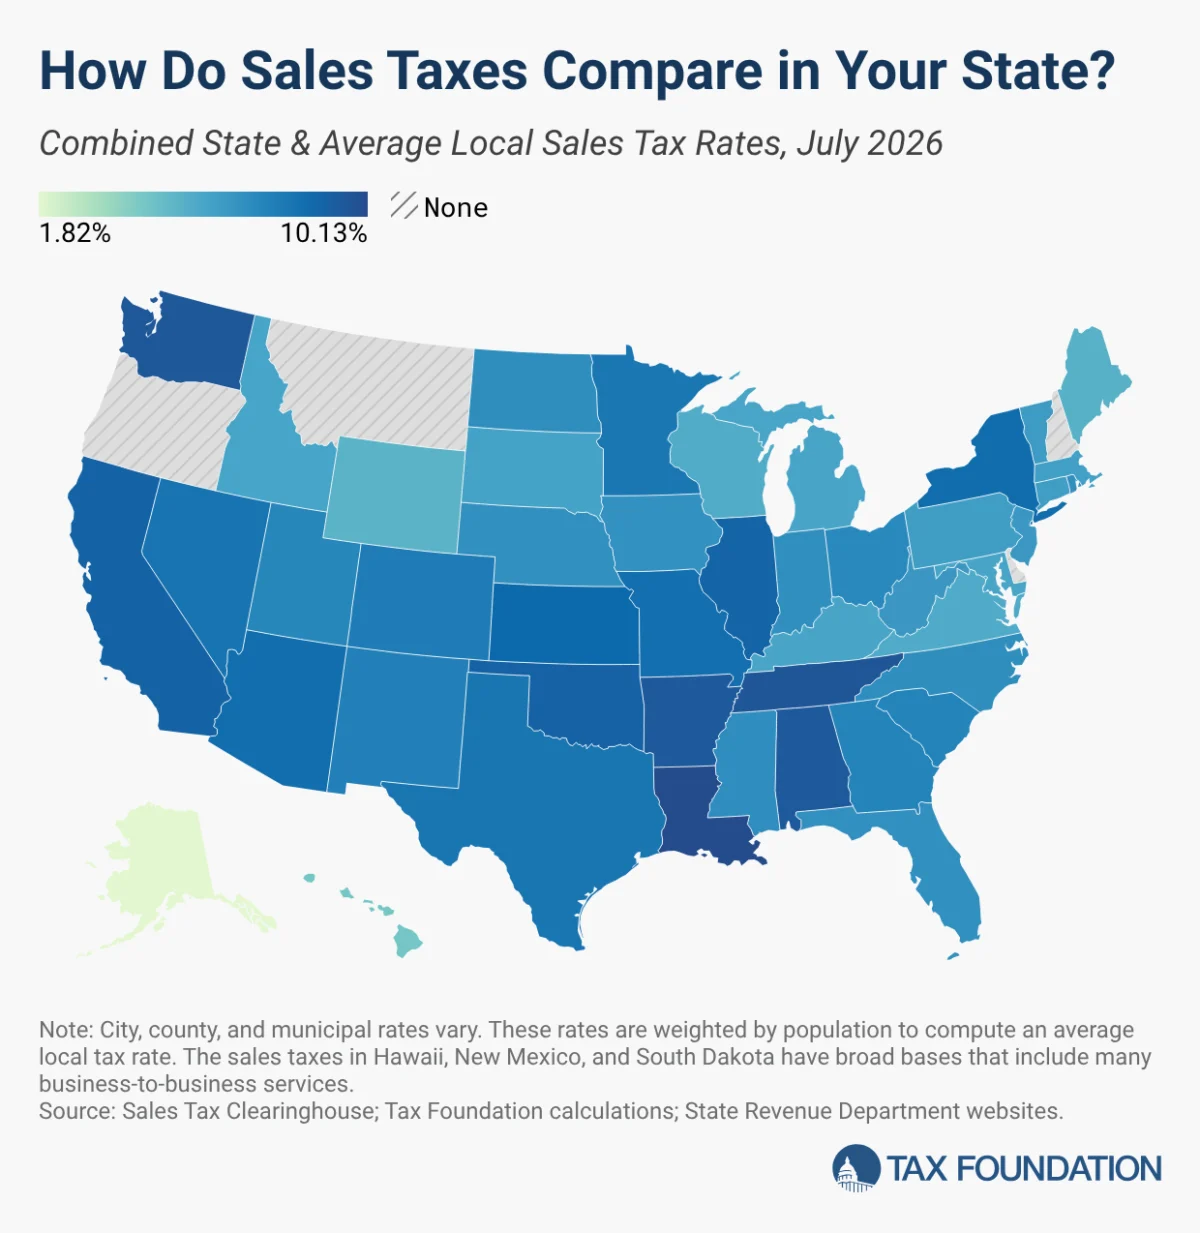
The result is a national population-weighted average combined sales tax rate of 7.53 percent. However, this average masks significant regional disparities. The five states with the highest combined tax burdens—Louisiana (10.13 percent), Tennessee (9.61 percent), Washington (9.57 percent), Arkansas (9.48 percent), and Alabama (9.46 percent)—demonstrate how local add-ons can fundamentally reshape the tax profile of a state.
The "No-Tax" Exception
It is important to note the outliers in this framework. Five states—Alaska, Delaware, Montana, New Hampshire, and Oregon—do not impose a statewide sales tax. Of these, only Alaska permits its local municipalities to levy their own sales taxes. These states often leverage their tax-free status as a primary tool for economic development, frequently attracting retail traffic from neighboring states where consumption taxes are significantly higher.
A Chronology of Rate Shifts (2025–2026)
The landscape of sales taxation is rarely static. The most significant recent shift occurred in January 2025, when Louisiana increased its state-level rate from 4.45 percent to 5 percent. This adjustment was not an isolated tax hike but rather a component of a comprehensive fiscal reform package. By coupling the sales tax increase with the adoption of a 3 percent flat individual income tax, a 5.5 percent corporate income tax, the implementation of full expensing for capital investments, and the repeal of the franchise tax, Louisiana aimed to trade a consumption-heavy revenue model for a more competitive environment for business investment.
In the months leading up to July 2026, the trend has been one of stabilization rather than systemic change. There were no statewide tax rate changes between January and July 2026. Instead, activity has been localized. North Carolina, Georgia, California, and Vermont saw marginal increases in their combined rates due to localized policy decisions. Conversely, Wyoming was the rare exception, recording a reduction in its combined rate following several local jurisdictions’ decisions to scale back their local-option tax rates in February and July.
Recent Legislative Trends
Policy priorities have clearly shifted away from modifying sales tax rates toward aggressive income tax reduction. Lawmakers have increasingly viewed income tax cuts as providing a more direct and potent "pro-growth" stimulus. Consequently, significant sales tax rate reductions have become rare. Notable historical adjustments—such as South Dakota’s 2023 rate cut (slated to sunset in 2027) and New Mexico’s 2022 reduction of its "gross receipts tax"—stand out as exceptions in an era where state legislatures prioritize income-based relief.
Supporting Data: The Impact of Local Options
To understand the true cost of consumption, one must look beyond the state capital. Local sales taxes are the "hidden" variable in the equation. Currently, the states with the highest average local sales tax rates are Alabama (5.46 percent), Louisiana (5.13 percent), Colorado (4.99 percent), Oklahoma (4.56 percent), and New York (4.54 percent).
Regulatory Nuances and Exceptions
- Mandatory Add-ons: States such as California (1.25 percent), Utah (1.25 percent), and Virginia (1 percent) levy mandatory local add-on taxes at the state level. These are functionally treated as part of the state’s total sales tax rate.
- The New Jersey Anomaly: Salem County, New Jersey, operates under a unique structure where it is exempt from the statewide rate, instead collecting a specific local rate of 3.3125 percent.
- Broad-Base States: Hawaii, New Mexico, and South Dakota maintain "broad-base" sales taxes that extend to business-to-business services. While this captures more revenue, it risks "tax pyramiding," where the same transaction is taxed at multiple stages of production, ultimately increasing the cost to the end consumer.
Economic Implications: Competition and Revenue
The competition between jurisdictions creates tangible behavioral shifts. When a significant rate differential exists between two neighboring areas, the "border effect" becomes pronounced. Consumers demonstrate a clear willingness to travel from high-tax central cities to low-tax suburbs to make major purchases.
The Border Economy
Perhaps the most striking evidence of this occurs along the Connecticut River. Even though Interstate 91 runs along the Vermont side of the river, retail development is heavily skewed toward New Hampshire, which maintains no statewide sales tax. Research indicates that per capita sales in New Hampshire’s border counties have tripled since the 1950s, while Vermont’s border counties have remained stagnant. This serves as a warning to policymakers: when tax rates become too high relative to neighbors, the result is often not higher revenue, but rather the migration of commerce and, eventually, the erosion of the tax base itself.
The "Urban Enterprise Zone" Strategy
Some states attempt to mitigate these pressures through localized relief. New Jersey, for instance, utilizes "Urban Enterprise Zones," where qualifying sellers collect sales tax at exactly half the statewide rate (3.3125 percent). This policy is designed to keep local businesses competitive in an otherwise high-tax environment.
The Role of the Sales Tax Base
A common misconception is that the "rate" is the only factor determining the impact of a sales tax. In reality, the "base"—what is actually taxed—is equally vital.
While tax experts advocate for a broad base that captures all final retail sales of goods and services, the reality is far more convoluted. Most states provide exemptions for necessities like groceries or clothing, which, while socially popular, necessitates a higher overall tax rate to maintain revenue targets.
Hawaii serves as the ultimate case study in base-broadening. By taxing a wide array of business services, Hawaii has the broadest sales tax base in the nation, effectively taxing an estimated 119 percent of the state’s personal income. In contrast, the national median applies the sales tax to only 36 percent of personal income. While Hawaii’s model generates significant revenue, it also demonstrates the risks of taxing business-to-business transactions, which can increase the cost of living and production across the entire economy.
Conclusion: Toward a Modernized Tax Regime
As of mid-2026, the U.S. sales tax system remains a complex patchwork of state-mandated rates and local-option levies. For state legislatures, the challenge remains balancing the need for reliable revenue with the risks of economic distortion and cross-border retail flight.
The evidence suggests that states are increasingly cautious about raising sales tax rates, preferring instead to focus on modernizing their tax bases or pursuing income tax reductions. For the taxpayer, the takeaway is clear: the "sticker price" on a receipt is increasingly a function of local governance and geography. As the economy evolves, the ideal path for state governments is to shift toward "right-sized" tax systems—those that are broad-based, simple to administer, and applied only once to each product, thereby minimizing the drag on long-term economic growth.
