





It is a familiar frustration for the modern commuter: two people standing on the same street corner, booking identical rides to the same destination, only to be quoted vastly different prices. While the algorithms behind Uber and Lyft’s dynamic pricing remain a "black box," a new analysis is pulling back the curtain on a significant, often overlooked component of the fare: insurance.
According to a comprehensive report from gig economy analytics firm Gridwise, a staggering 21% of the average rideshare fare is currently being funneled directly into insurance costs. This revelation complicates the ongoing debate regarding the "take rate"—the percentage of a fare that companies like Uber and Lyft retain—and highlights how the rising cost of coverage is fundamentally reshaping the economics of the gig economy.
The Anatomy of a Rideshare Fare
For years, passengers and drivers alike have speculated about where their money goes. While debates have raged over whether ride-hailing giants are claiming as much as 50% of the total fare value, the insurance line item provides a concrete, data-backed look at the overhead that must be satisfied before a driver sees their cut.
The Gridwise study clarifies that this 21% figure is specific to rideshare services. Delivery platforms, while subject to their own logistical challenges, carry lower insurance burdens because they do not transport human passengers, which inherently lowers the liability risk for the platform.
A Breakdown of the Numbers
- National Average Insurance Cost: 21% of total fare.
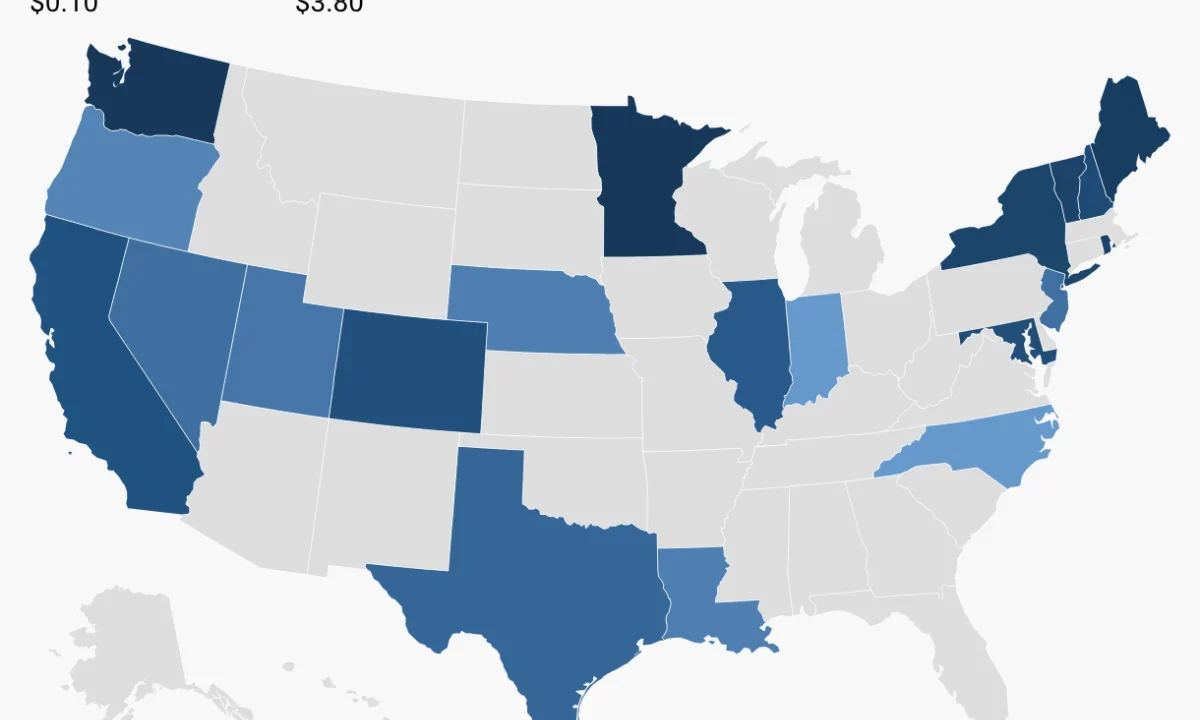
- Regional Variance: While the national average remains high, the burden is not distributed equally.
- Platform Consistency: Uber and Lyft both grapple with similar insurance cost structures, as both companies operate under the same regulatory requirements for commercial passenger liability.
A Chronology of Rising and Falling Premiums
To understand how we arrived at this 21% threshold, one must look at the shifting regulatory landscape and the volatility of the insurance market over the last 24 months.
The 2025 Market Correction
In 2025, the broader U.S. insurance market experienced a slight cooling, with average premiums for private vehicle owners dropping by approximately 6%. However, this national trend masked a fractured reality. While many states saw minor relief, regions like New Jersey saw a 20% spike in insurance rates, proving that geography remains the primary driver of cost volatility.
Q1 2025 to Q1 2026: The Shift in Rideshare
Between the first quarter of 2025 and the same period in 2026, both Uber and Lyft managed to reduce their per-ride insurance expenses by more than 5% nationwide. This was a rare moment of fiscal relief for the platforms, largely driven by legislative intervention in the Western United States.
The California Exception (SB 371)
The most significant data point in the Gridwise report centers on California. Senate Bill 371, designed to streamline and lower the mandatory requirements for uninsured and underinsured motorist coverage for rideshare drivers, led to a 20.6% drop in insurance costs for rides in the West.
The Myth of "Passing Savings Along"
The introduction of California’s SB 371 serves as a masterclass in the divergence between legislative intent and corporate behavior. Lawmakers in Sacramento crafted the policy with the explicit hope that reducing the insurance burden on gig platforms would result in cheaper fares for consumers and potentially higher take-home pay for drivers.
However, the economic reality of 2026 has proven otherwise. Despite the 20.6% reduction in insurance overhead, consumer pricing in the region actually increased by 3.4%. Even more striking, the "platform fees"—the portion of the fare kept by the company—surged by 29.1% in the same timeframe.
This trend confirms a growing suspicion among economists: in a highly consolidated market, cost savings achieved through deregulation are rarely passed down to the consumer. Instead, they are often absorbed by the platform to bolster margins or satisfy investor demands for profitability.
Regional Disparities and "Insurance Deserts"
The study also underscores a troubling socioeconomic trend. While the West saw costs plummet, other regions experienced significant price hikes. The Southwest saw insurance costs rise by 15.8%, while the East Coast faced a 7% increase.
Perhaps most concerning is the impact on vulnerable demographics. In Chicago, for instance, the study identified that insurance coverage expenses were 37.6% higher in the city’s 20 lowest-income ZIP codes compared to the rest of the metropolitan area. This creates a "double-tax" effect: lower-income riders are forced to pay a premium for the same service, driven by the higher risk assessments associated with their neighborhoods.
Official Responses and Corporate Strategy
The debate surrounding the "50% take rate" remains a point of contention. While independent analysts, such as those cited in recent Medium reports, have argued that Uber’s effective take rate has reached 50% of the total fare, the company has consistently denied these figures.
Uber’s official position has been that their take-home percentage is lower when accounting for incentives, driver bonuses, and the high cost of insurance and safety initiatives. Lyft has echoed similar sentiments, framing their fees as a necessary investment in "platform reliability" and "insurance compliance."
However, with the Gridwise data providing a clear look at the 21% insurance overhead, the conversation is shifting. Advocacy groups are now calling for greater transparency, arguing that if 21% of every dollar goes to insurance, the remaining "pie" is far smaller than the platforms suggest, and that this creates an unsustainable environment for drivers.
Implications for the Future of Rideshare
The implications of this report are three-fold:
- The Regulatory Trap: The California experience demonstrates that lobbying for insurance reform may not be enough to lower prices. Unless regulators explicitly mandate that cost-savings be passed to the consumer or the driver, the corporations are likely to retain the difference.
- Increased Economic Stratification: The data on Chicago’s lower-income ZIP codes suggests that the cost of rideshare is becoming a tool of economic exclusion. If insurance premiums continue to be pegged to localized risk factors, the gig economy risks becoming an affordable luxury for the wealthy while becoming prohibitively expensive for those in high-risk, lower-income areas.
- Pressure on the Business Model: As insurance continues to consume more than one-fifth of every fare, the pressure on Uber and Lyft to find efficiencies will only grow. This could lead to a further reduction in driver benefits or the implementation of even more aggressive surge pricing, as platforms look for ways to protect their margins against fluctuating insurance costs.
Conclusion
As we move deeper into 2026, the intersection of insurance, regulation, and platform pricing has become the most critical frontier for the rideshare industry. The Gridwise report serves as a wake-up call: the price you pay for your ride is not just a reflection of supply and demand, but a complex calculation of liability and corporate margin.
For the average consumer, the lesson is clear: when you see your fare spike, it is rarely due to a single factor. It is a combination of regional insurance risk, corporate fee adjustments, and a regulatory environment that has yet to figure out how to balance the profit motives of tech giants with the economic realities of the average commuter. As long as insurance remains a dominant cost, the volatility of the rideshare market is unlikely to settle, leaving both drivers and passengers at the mercy of an increasingly expensive and opaque system.
